Introduction to eCapture
eCapture is designed for high-volume electronic data discovery (EDD) processing and incorporates
a distributive processing model whereby Discovery Jobs, Processing
Jobs, Data Extract Jobs, and Export Jobs are distributed to multiple workers
simultaneously. The processes are designed around jobs, not sequential
processing. eCapture was designed around SQL for large scale data
storage. The Enterprise platform works with eCapture and Ipro Eclipse. For more
information about Enterprise and Ipro Eclipse, visit www.iprotech.com. To learn more about how to use Enterprise and Ipro Eclipse, visit the Ipro Help Center.
Overview: eCapture Controller
When a job (Discovery, Processing, Export) is created from the eCapture Controller, the eCapture Workers are automatically assigned
the tasks of completing those jobs. The Worker workstations perform the
actual discovery and processing of the electronic files. The Workers wait
for the tasks assigned by the eCapture Queue Manager.
All data that is discovered is indexed (optionally), hashed, and extracted,
allowing for one or more Processing Jobs or Data Extraction Jobs to be
run using a single data set. There is no need to re-discover the same
set of data. Search and/or process as many times as necessary. In addition,
Data Extract Jobs or Processing Jobs can be created using more than one
Discovery Job. Export Jobs are based off of one or more completed Processing
Jobs or Data Extract Jobs.
Microsoft’s Enhanced Linguistic Service (ELS) was implemented to handle
language identification for standard eCapture Discovery Jobs. Indexing
is required for language identification in Discovery. If OCR is applied,
language identification occurs using OCRed text.
The Flex Processor Rules Manager delivers measurable cost savings by reducing data collections
prior to processing. The Flex Processor Rules Manager uses a rule-based
system, similar to Microsoft Outlook, which allows an action set to be
performed on a specific selection of files. Searching, Filtering, QC Flags,
NIST (National Institute of Standards and Technology) of matches, and
other criteria are all accessed from the Flex Processor Rules Manager
interface.
Export Sets harness the power of QC. You can use Export Sets to create an export at the individual document level with sort capabilities. Export
Series make it easier to output successive unattended
exports that contain sequential image key numbering and volumes.
eCapture Hierarchy
The eCapture hierarchy is as follows.
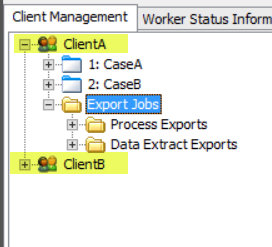
Clients are at the top of the hierarchy.
Each Client has Cases (Projects).
Each Client also has Export Jobs. Under Export Jobs, you create Data Extract Export Jobs and Data Extract Export Series. Under Export Jobs, you also create Processing Export Jobs and Processing Export Series.
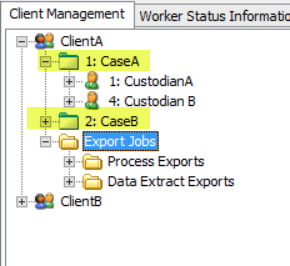
Each Case (Project) has Custodians.
Each Custodian has Jobs (Streaming Discovery, Discovery, Data Extract, Processing Jobs). Streaming Discovery jobs combine a traditional Discovery Job with a Data Extract Job.
eCapture Workflow
- First, you create a Client. After the Client is created, the next step is to create the Case (Project)
and the Custodian.
-
When creating a new eCapture Case (Project), the
system will automatically display the Case (Project) Options (by default)
so that you may select these options before proceeding with Discovery
Jobs, Processing Jobs, or Data Extract Jobs for the new Case (Project).
-
When creating Discovery Jobs, Processing Jobs, or Data Extract Jobs
individually, the system will automatically display the options for the
relevant job type.
|

|
Note: The case (project) options can be viewed and/or modified for each separate
case (project) as well as for each individual job type.
|
- After Clients, Cases (Projects), and Custodians are set up, Discovery
can begin.
- When a Discovery Job is created, a directory of the data collection
is selected for Discovery. This process involves traversing a directory
of electronic data and examining the file types in that directory. All
data is hashed and indexed at this time.
- Once a Discovery Job exists, multiple Processing Jobs or Data Extract
Jobs can be created based on it. There is no need to repeat the discovery process
on that directory. A Processing Job can be based on incomplete Discovery
Jobs but will not execute until all dependent jobs are complete.
- After the Processing and Data Extract Jobs are completed, QC can be
performed.
- After the Processing Jobs or Data Extract Jobs complete, the jobs are
available for export.
The following diagram provides a high-level overview of the eCapture processing workflow.
|

|
Tip: Click on a box in the workflow diagram to jump to the corresponding procedure topic.
|

eCapture Modules and Components
The following table lists the modules that are included with eCapture and provides a description for each module.
|
Controller
|
A console used for
creating Clients, Cases (Projects), Custodians, Discovery Jobs, Data Extract
Jobs, Processing Jobs, managing/assigning task tables, creating export
series, viewing detailed information about each Worker and the tasks being
performed.
|
|
Limited Controller
|
Designed
to give full viewing access to Clients, Cases (Projects), and Jobs. Jobs
may be created but not started from the Limited Controller. Additional
functionality includes managing merge jobs and running reports. Clients may be created from the Limited Controller.
|
|
Queue Manager
|
Assigns jobs
to Worker workstations, shows activity
for each Worker and the task type being performed, and shows status for
each Worker.
|
|
Worker
|
An agent application
that resides on the Worker workstations. It processes Discovery Jobs,
Data Extract Jobs, and Processing Jobs that are started through the eCapture Controller. Each Worker workstation has its own license.
|
|
Quality Control (QC)
|
Checks
the accuracy of processed jobs by category and/or flags. View metadata
and extracted text/OCR for each image. Create export sets.
|
|
Reports
|
Numerous reports are
available for Discovery Jobs, Data Extract Jobs, and Processing Jobs that
include but are not limited to Comprehensive, De-duplication, Search,
and Discovery. A new reporting function allows for multiple job selection
of the same type. In addition, reporting is now available for export jobs.
|
Run the eCapture Controller
The full eCapture Controller (associated with a single eCapture Configuration database) may be run on multiple machines for more efficient management of jobs and improved auditing.
The following functions may be performed by users from any eCapture Controller with the last action taken, for each function, taking precedence.
-
Create new clients
-
Create projects
-
Modify projects
-
Set project-level defaults for any job
-
Start, pause, or delete any job
-
Associate project to an enterprise codename
-
Rename clients, projects, and jobs
-
Drag or drop export sets for any project
-
Update task table
-
Fail task on any job
-
Update worker patch management
-
Edit system options
|
-
Update NIST database configuration
-
Create, modify, or delete flex processor rules for any job.
-
Create custom hash lists for any job
-
Configure remote desktop options for workers
-
Edit export field lists for any job
-
Validate process jobs for any project
-
Deactivate or activate clients
-
Configure low disk space cutoff
-
Perform post-process operations on any job
-
Restart workers from worker patch management
|
eCapture Controller User Interface
The eCapture Controller serves as a command center where several
different job types (Discovery, Data Extract, Processing, and Export)
can be created, edited, monitored, assigned priorities, and deleted with
ease.
The eCapture Controller user interface is designed for viewing
the status of all the Workers that are actively connected to the eCapture database. The Workers perform discovery and processing in addition
to other job functions. View all tasks that are currently running as well
as tasks that are waiting in the queue.
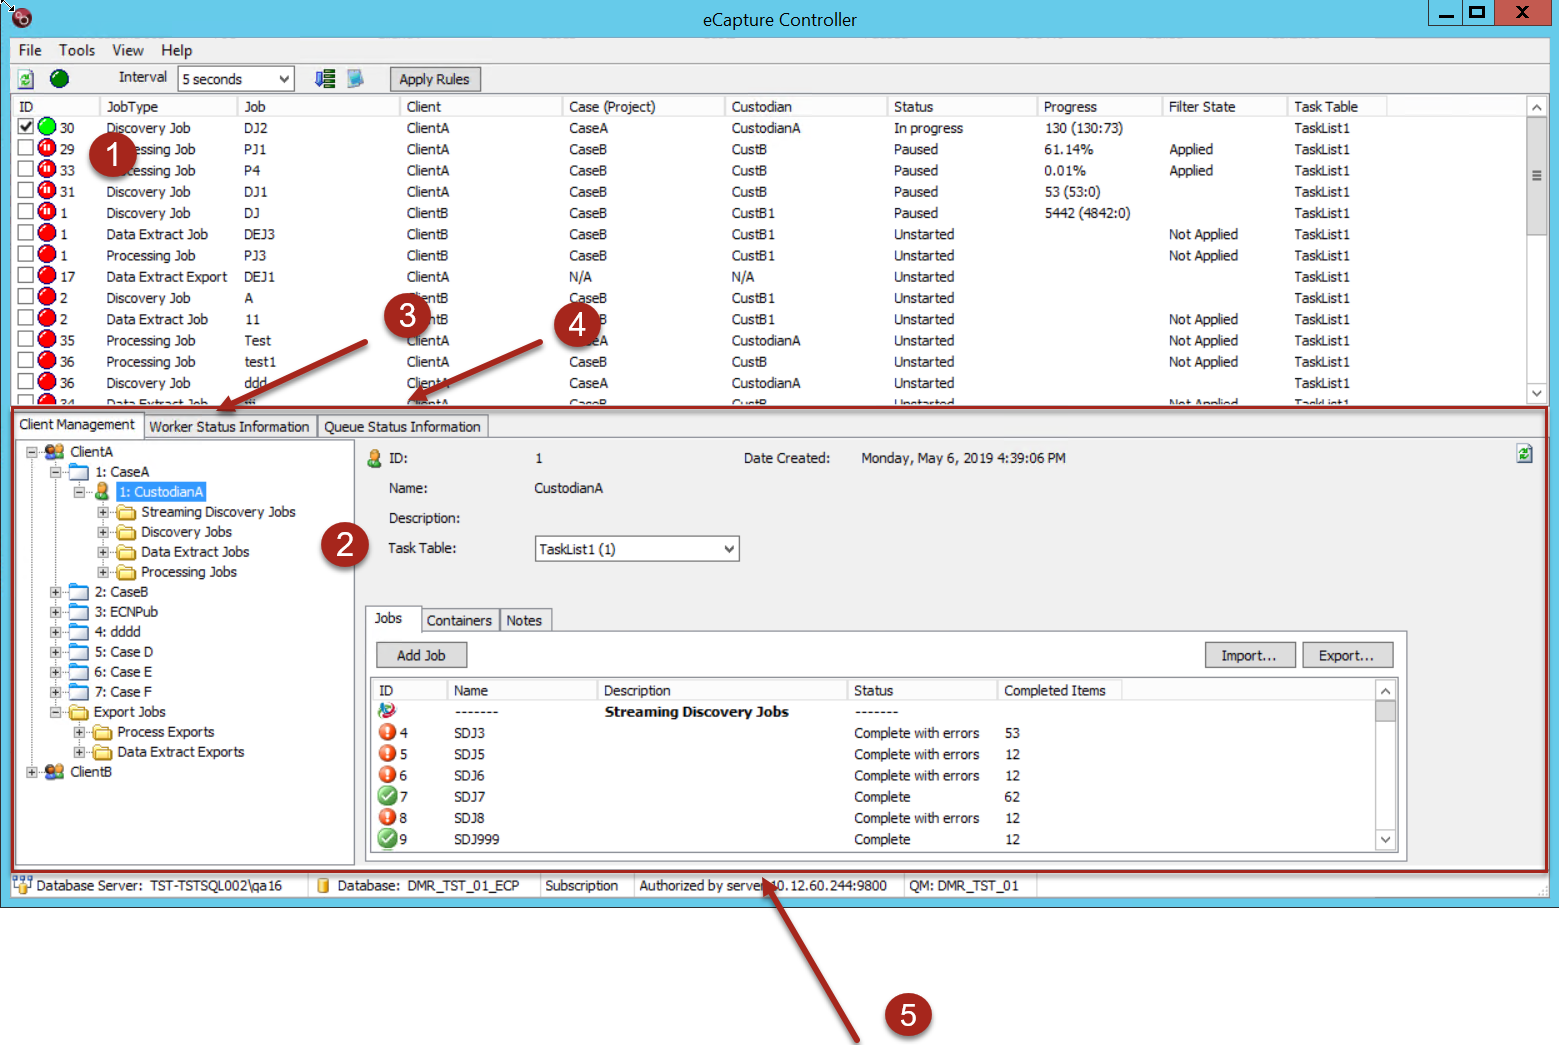
The eCapture Controller is organized into panes and tabs.
- Job Queue Pane - Displays a list of jobs and their status.
- Client Management Tree View and Status and Summary Panel - Displays clients and their cases (projects), custodians, and jobs (organized by job type).
- Worker Status Information Tab and Pane - Displays the registered and active workers
- Queue Status Information Tab and Pane - Displays the queued and active tasks by Task Table.
- Controller Status Bar - Displays database, subscription, and user information.
The following sections outline each of the various areas of the eCapture Controller user interface and provide links to topics related to the specific tasks performed in the application.
The Job Queue Pane provides a List of jobs and their statuses. Just above the Job Queue Pane is the eCapture toolbar that lists information about jobs in the Job Queue.
Job Queue Pane
The Job Queue pane is located in the top half of the eCapture Controller
user interface.
The columns are as follows:
- ID - Used by SQL.
- Job Type - The type of job being executed. The options are Discovery, Streaming
Discovery, Data Extract, Export, or Processing.
- Job - The name assigned.
- Client - The client assigned to the job.
- Case (Project) - The Case name
assigned and which Project the job is a part of.
- Custodian - The custodian for the selected job.
- Status
- The state the job is in, such as In Progress or Paused.
- Progress - The information displayed in the Progress column varies depending on whether or not indexing is enabled.
- If Indexing is not enabled, the Progress column will show the total number of
Index items followed by the number of actual items that were completed,
e.g. 2546 (1324).
- If indexing is enabled, the Progress column will show the number
of items indexed. Using the previous values, 2546 (1324:456), the second
value in the parenthesis (456) reflects those items that have been indexed. For multiple discovery jobs in a multi-worker environment, the retry progress
is shown for index entries remaining. For example, the values displayed
are 512 (512:67 - 45), where 45 would indicate index tries remaining only
if there are incomplete retries. Index retries remaining will count down;
that is, get smaller as retries are completed. Processing Jobs and Data
Extract Jobs show percentage complete, e.g. 23.81%, out of 100%.
- Filter
State - The Filter
State shows whether Filtering was applied for that job.
- Task Table - The task table assigned to the selected job.
The Job Queue Pane remains static regardless of which tab is accessed
underneath it. However, the data within the Job Queue Pane is dynamic
based on the discovery job, data extract job, export job, and/or processing
job activity.
Once a job’s progress is completed, it disappears from the queue. All queue related options (interval refreshing, job priority changing,
manual refreshing) are disabled while queue operations are being performed. Clearing the check box in the Job Queue pauses the job but it still
remains in the queue. Jobs may not be paused during the Job start or Job
completion phases. To start any job, select the check box for that job.
To locate the selected job in the Client Management Tree View, right-click the
job (in the Job Queue) to display the right-click context menu. Click Locate jobname. The job highlights in
the Tree View.
Job Toolbar Icons
The icons/options in the eCapture Controller toolbar  are as follows:
-
Refresh Icon: Click it to refresh the Queue.
-
Green Circle Light: Queue operations light. This light changes to light
green to indicate queue activity.
-
Processing Update Intervals: To control how frequently the processing status updates, select an Interval
Value from the drop-down menu in the eCapture toolbar. Interval Values
are Off, 5, 10, 15, 20, 25, and 30 seconds as well as 1, 2, 5, 10, and
30 minutes.
If you do not want updating to occur, select OFF in the drop-down
menu.
|

|
Warning: Turning the interval OFF will prohibit Job start
and Job completion routines to complete.
|
- Job Queue Priority Icon: You can change a job’s position in the queue by either moving it before
or after another job in the queue using the Change Job Priority function.
For more information, seeChange the Priority of a Job in the Queue.
- Show Log File Icon: Errors are logged to a file named CONTROLLER.LOG. When an error occurs,
the Show Log File
 icon will
change to a Warning
icon will
change to a Warning  icon.
Click the warning icon. Notepad opens and displays the error(s), and the
Warning Icon changes back to the Show Log File icon. Whenever an error
is encountered, the Warning Icon will display in the Controller
toolbar. This file records all job status changes and any timeouts or
errors reported during the job start sequence or during the job queue
refresh. It also records the start of the deletion agent.
icon.
Click the warning icon. Notepad opens and displays the error(s), and the
Warning Icon changes back to the Show Log File icon. Whenever an error
is encountered, the Warning Icon will display in the Controller
toolbar. This file records all job status changes and any timeouts or
errors reported during the job start sequence or during the job queue
refresh. It also records the start of the deletion agent.
-

|
|
Note: Use the Apply Rules dialog box if the rules you want to apply were not already applied from the Flex Process Rules Manager.
|
Click to open the Apply Rules dialog box and apply rules to one or more selected jobs from the Job Queue pane before starting the jobs if the rules were not already applied from the Flex
Processor Rules Manager.
On the left side of the lower portion of the eCapture window, the Client Management Tree View displays. The Tree View is an organized visual representation of Clients, Cases
(Projects), Custodians, the Custodian’s jobs (discovery, data extract,
or processing), and Export Jobs.
When the Client Management tab is selected, the Status and Summary Panel, on the right, displays the summary information for the selected Client, Case (Project), Custodian, Job Type, or Job.
By right-clicking the different items, various right-click context menus display
that allow you to take action on the selected Custodian, Case (Project), Job Type, or Job.
Clients
On the Client Management Tree View, when you click a client, the Status and Summary Panel displays a Cases (Projects) tab and a Notes tab.
- Cases (Projects) tab - The Cases (Projects) tab lists the cases and custodians related to the selected client. You can double click a case or custodian to navigate to the selected item in the Client Management Tree View. and view summary information about the selected case.
- Notes tab - On the Notes tab you can type add notes related to the selected client.
Cases (Projects)
On the Client Management Tree View, when you click a case or custodian, the Status and Summary Panel displays the Jobs, Containers, and Notes tabs.
- Custodians tab - The Custodians for the selected Case (Project). Click the Add Custodian button to add a new Custodian to the Case (Project).
- Containers tab - The Containers tab shows information about containers identified in the project. Containers are files that contain other files. For example, eCapture can extract a PST file that has MSG files. MSG files might also have attachments, such as Word, Excel, PowerPoint, or Image files. The fields displayed in the tab, include Name of a user-defined Container (node), the Custodians, Discovery Jobs (a semicolon-delimited list in which containers exist), Data Extract Jobs (a semicolon-delimited list in which containers exist), Processing Jobs, (a semicolon-delimited list in which containers exist) and Path to the container. On the Containers
tab, you can click the Export button to export the list of containers to a CSV file.
- Notes tab - On the Notes tab you can type add notes related to the selected Case (Project).
Custodians
On the Client Management Tree View: when you click a custodian, the Status and Summary Panel displays the Jobs, Containers, and Notes tabs.
-
Jobs tab - The Jobs tab lists jobs for the selected Case or Custodian.
When the root level of the Custodian is selected, the Status and Summary Panel displays
a list of the jobs and their current status.
Right-click (or double click)
any job in the list to display the context menu selection Locate Jobname. Click the selection to go to that job in the Client Management Tree View. The Information Panel
changes from list view to the details about the selected job.
The columns can be sorted in Ascending or Descending order by clicking
the column heading. For example, click the column heading ID to sort the
ID numbers in Descending order. Click the column again to change the sort
to Ascending order.
A Task Table drop-down menu is available on each panel to facilitate
the ease of changing the Task Table if necessary. For example, the currently
selected Task Table for the Custodian will show as the default task table
when a new Job (Discovery, Processing, or Data Extract) is created.
Icon Descriptions:
-
 indicates that job completed
with errors. This icon appears for Discovery jobs only. Double-click the
job in the list to go to the Status and Summary Panel for the job.
indicates that job completed
with errors. This icon appears for Discovery jobs only. Double-click the
job in the list to go to the Status and Summary Panel for the job.
-
 indicates job completed with
no errors
indicates job completed with
no errors
-
 indicates job completed with
errors.
indicates job completed with
errors.
-
Containers tab - The Containers tab shows information about containers identified in the project. Containers are files that contain other files. For example, eCapture can extract a PST file that has MSG files. MSG files might also have attachments, such as Word, Excel, PowerPoint, or Image files. The fields displayed on the tab include the Name of a user-defined Container (node), the Custodians, Discovery Jobs (a semicolon-delimited list in which the container exists), Data Extract Jobs (a semicolon-delimited list in which the container exists), Processing Jobs, (a semicolon-delimited list in which the container exists) and the Path to the container. On the Containers
tab, you can click the Export button to export the list of containers to a CSV file.
-
Notes tab - On the Notes tab you can type add notes related to the selected custodian.
Job Type Folder
On the Client Management Tree View, when you click on a jobs folder (Streaming Discovery, Discovery, Data Extract, or Processing) , the Status and Summary Panel displays the Jobs, Containers and Notes for the selected job type.
-
Jobs Tab - The Jobs tab lists all of the jobs of the job type selected for the Custodian.
When the root level of the Streaming Discovery Jobs, Discovery Jobs, Data Extract Jobs,
or Processing Jobs is selected, the Status and Summary Panel displays
a list of the jobs and their current status.
Right-click (or double-click)
any job in the list to display the context menu selection Locate Jobname. Click the selection to go to that job in the Client Management Tree View. The Information Panel
changes from list view to the details about the selected job.
The columns can be sorted in Ascending or Descending order by clicking
the column heading. For example, click the column heading ID to sort the
ID numbers in Descending order. Click the column again to change the sort
to Ascending order.
A Task Table drop-down menu is available on each panel to facilitate changing the Task Table if necessary. For example, the currently
selected Task Table for the Custodian will show as the default task table
when a new Job (Discovery, Processing, or Data Extract) is created.
Icon Descriptions:
-
indicates that job completed
with errors. This icon appears for Discovery jobs only. Double-click the
job in the list to go to the Status and Summary Panel for the job.
-
indicates job completed with
no errors
-
indicates job completed with
errors.
- Containers Tab - Displays a list of the containers for the selected job type. On the Containers
tab, you can click the Export button to export the list of containers to a CSV file.
- Notes Tab - On the Notes tab you can type add notes related to the selected job type.
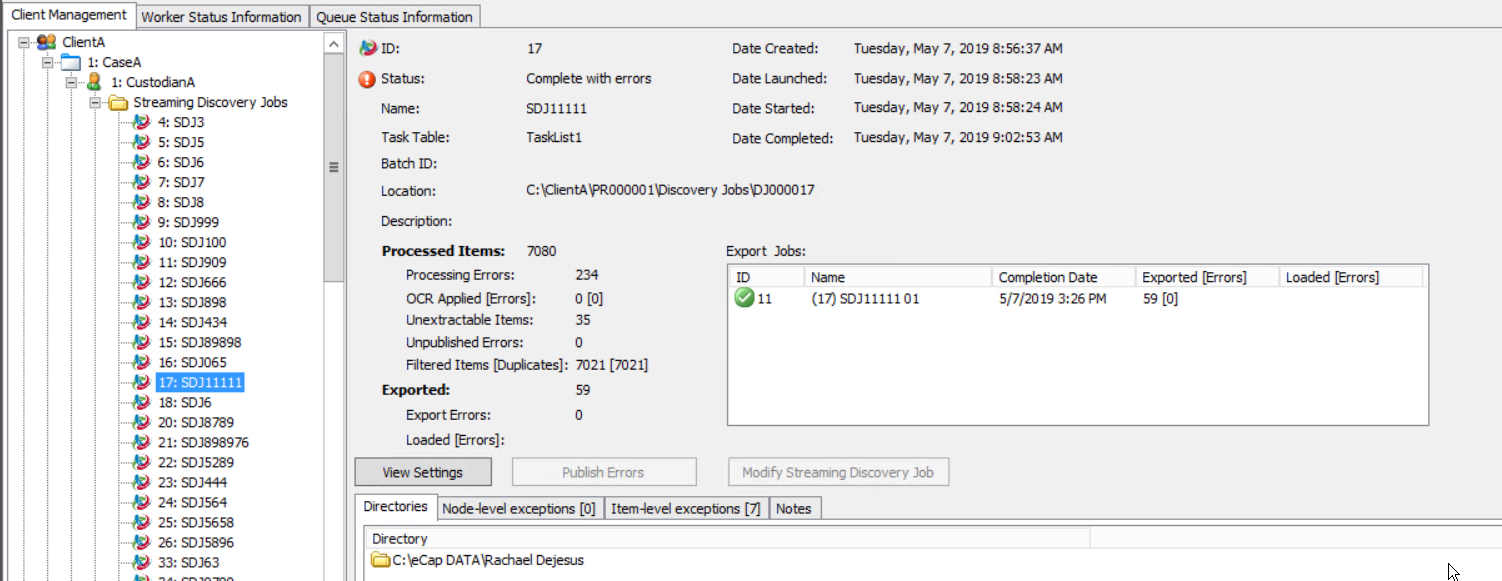
Discovery and Streaming Discovery Jobs
On the Client Management Tree View, when you click either a Discovery Job or a Streaming Discovery Job, the Status and Summary Panel displays the Directories, Node-level exceptions, Item-level exceptions, and Notes tabs.
- Directories tab - Displays a list of directories where data is stored for the selected job.
-
Node-level exceptions tab - The Node-level exceptions tab lists the number
of node-level exceptions in parentheses. Click the tab to view the exceptions.
A node-level error means that a problem was encountered when extracting the
contents of a container (for example, the email store, a folder within the email store,
or a loose file with attachments). Node-level errors indicate that items are
missing from the production set. Item-level errors mean that an error
was encountered on a specific item. If items in the production are password protected, these items should be reflected in the Detailed Error Report that
lists errors and status messages encountered during discovery. Indexing
errors means that dtSearch encountered an issue when trying to acquire the
text of a document. The Requeue Attempts column lists the number of times
the node-level exception was requeued. The Date Last Requeued column lists
the date when the node-level exception was last requeued.
Double-click the exception to open the Discovery
Error Information dialog box to read information about the error.
- Item-level exceptions tab - The Item-level exception tab lists the number of item-level exceptions in parenthesis.
- Notes Tab - On the Notes tab you can type add notes related to the selected job .
To view a list of the Discovery Job fields displayed on the Summary panel, and tasks you can perform by clicking the available buttons, click  here.
here.
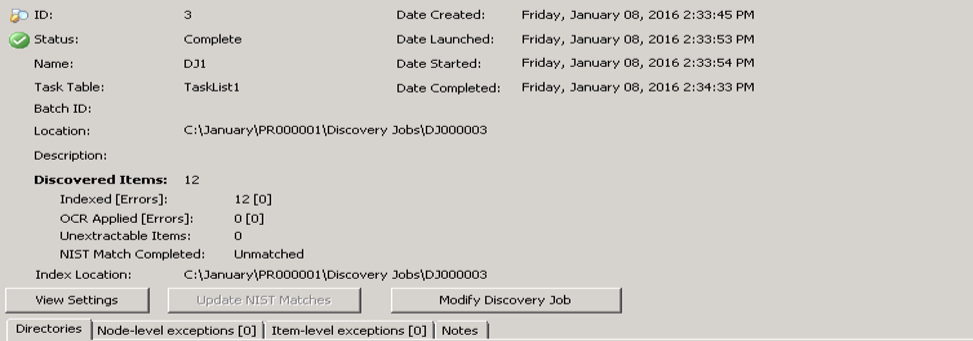
The Discovery
Job information includes:
- ID
- Status
- Name (double-click
to display the Rename Job dialog to rename the Job)
- Task Table
- Batch
ID (double-click to open Batch ID dialog if necessary to modify ID before starting job)
- Location (path where job files and the SETTINGS.INI
file are located; this path can either be the default path assigned by eCapture or can be user defined)
- Description
- Discovered
Items
- Indexed [Errors]
- OCR Applied[Errors] (where Applied shows the number
of documents that required OCR (not OCRed) and where [Errors] shows the
number of those documents that did not meet the specified average confidence
level)
- Unextractable Items (a count of files that were found but could
not be extracted)
- NIST Match Completed
- Index Location
- Date Created
- Date Launched
- Date Started (indicates when the job began its first actual
task)
- Date Completed and Index Status (displays if a job was indexed at
creation time with indexing details or displays a separate message for
the DEFAULT.ABC and/or the NOISE.DAT files if they were used to index).
If the job was not indexed at creation time,
then it can be indexed
afterwards.
- The View Settings button allows you to view the options set
for the selected job.
If the settings can be modified, the
 button displays. The job’s status determines whether the Discovery
Job options can be modified.
button displays. The job’s status determines whether the Discovery
Job options can be modified.
-
The Update NIST Matches function is used
if the NIST database is loaded or requires updating.
-
The Modify Discovery Job button is available
for completed Discovery Jobs that may require reindexing or node/item level exception requeuing.
For more information about jobs, see:
Overview: Jobs
Create a Discovery Job
Modify a Completed Discovery Job
Create a Streaming Discovery Job
Modify Streaming Discovery Jobs
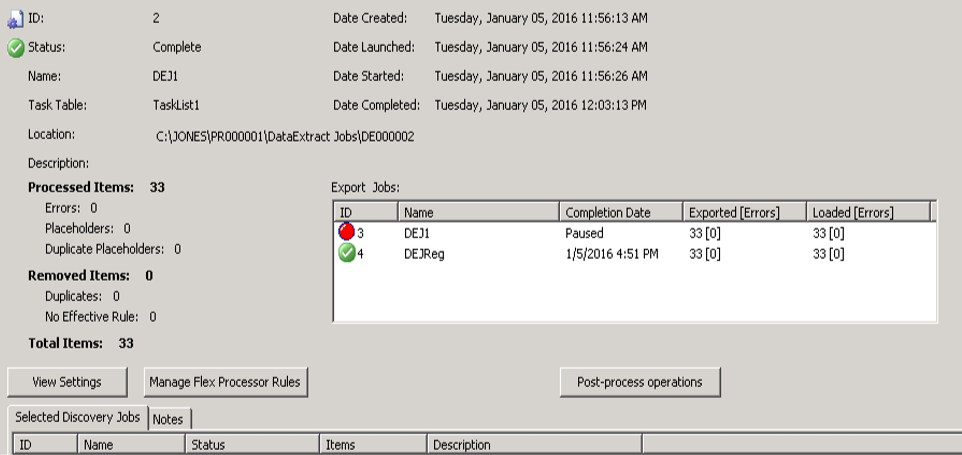
Processing and Data Extract Jobs
On the Client Management Tree View, when you click either a Data ExractJob or a Processing Job, the Status and Summary Panel displays the Selected Discovery Jobs and Notes tabs.
Selected Discovery Jobs tab - Displays the Discovery jobs associated with the selected Data Extract or Processing job.
Notes tab- On the Notes tab you can type add notes related to the selected job .
To view a list of Data Extract fields displayed at the top of the Status and Summary Panel, and tasks you can perform by clicking on the available buttons, click here.
The Data
Extract Job information includes:
- ID
- Status
- Name (double-click the name
to display the Rename Job dialog to rename the Job)
- Task Table
- Location (path where job files and the SETTINGS.INI
file are located; this path can either be the default path assigned by eCapture or can be user defined)
- Description
- Processed
Items (# of Errors, Placeholders, Duplicate Placeholders)
- Removed Items (# of Duplicates, No Effective Rule)
- Total Items (Process Items and Removed Items)
- Date Created
- Date Launched
- Date Started (indicates when the job began its first actual
task)
- Date Completed
The Export Jobs box shows
any created Exported Jobs with the ID, Name, Completion Date/Status, Exported
[Errors], and Loaded [Errors].
The Exported [Errors] field shows the
total number of exported documents with any encountered errors in brackets.
The Loaded [Errors] field shows the total number of exported documents
with any autoload errors (for either Eclipse or Relativity) in brackets.
For Streaming Discovery and Export Jobs that are not autoloading into
Eclipse or Relativity; and for incomplete Export Jobs, the Loaded
field will be blank. Exported and Loaded document counts will reflect
only completed Export jobs. As Export Jobs connected to Streaming Discovery
Jobs are completed, the counts will increase. The Loaded count will match
the Exported documents count unless errors occur during an Eclipse
or Relativity autoload.
- The View Settings button allows you to view the options set
for the selected job.
If the settings can be modified, the
button displays.
- The Manage Flex Processor Rules button allows you to access the Flex Processor Rules Manager. The job’s status determines
whether the Flex Processor Rules Manager options can be modified.
A message appears stating whether the options cannot be modified due to the
Job’s status.
- The Post-process operations button allows you to perform post-processing batch operations. The job's status determines
whether the options can be modified or post-processing can be performed.
-
The Selected Discovery Jobs tab shows the
ID, Name, Status, Items, and Description.
To view a list of Processing Job fields displayed at the top of the Status and Summary Panel, click here.
The Processing
Job information includes:
- ID
- Status
- Name (double-click the name
to display the Rename Job dialog to rename the Job)
- Task Table
- Location (path where job files and the SETTINGS.INI file
are located; this path can either be the default path assigned by eCapture or can be user defined).
- Description
- Processed
Items (# of Errors, Placeholders, Duplicate Placeholders)
- Removed Items (# of Duplicates, No Effective Rule)
- Total Items (Process Items and Removed Items)
- Date Created
- Date Launched
- Date Started (indicates when the job began its first actual
task)
- Date Completed
The Export Jobs box shows any
created Exported Jobs with the ID, Name, Completion Date/Status, Exported
[Errors], and Loaded [Errors].
The Exported [Errors] field shows the
total number of exported documents with any encountered errors in brackets. The Loaded [Errors] field shows the total number of exported documents
with any autoload errors (for either Eclipse or Relativity) in brackets.
For Streaming Discovery and Export Jobs that are not autoloading into
Eclipse or Relativity; and for incomplete Export Jobs, the Loaded
field will be blank. Exported and Loaded document counts will reflect only
completed Export jobs. As Export Jobs connected to Streaming Discovery
Jobs are completed, the counts will increase. The Loaded count will match
the Exported documents count unless errors occur during an Eclipse
or Relativity autoload.
For the selected job:
- The View Settings button allows you to view the options set
for the selected job.
If the settings can be modified, the
button appears.
- The Manage Flex Processor Rules button allows you to access the Flex Processor Rules Manager. The job’s status determines
whether the Flex Processor Rules Manager options can be modified.
A message displays stating whether the options cannot be modified due to the
Job’s status.
- The Post-process operations button allows you to perform post-processing batch operations. The job's status determines whether the options can be modified or post-processing can be performed.
For more information about Data Extract and Processing Jobs, see:
Overview: Jobs
Create a Standard Data Extract Job
Create a Standard Processing Job
Export Jobs
Export Jobs
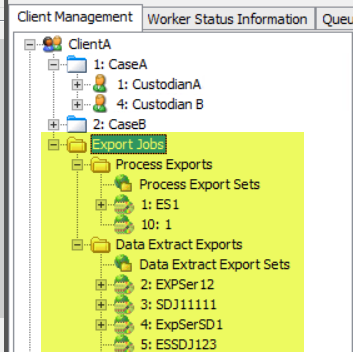
- the following display under Export Jobs
in the Client Management Tree View:
-
Process
Exports: displays a list of all
the exported Processing Jobs and Data Extract Jobs. When you right-click Process Exports, a context menu displays with
two options: New Process Export Job and New Process Export Series.
-
Process
Export Sets: displays a list of the Export Sets created
in QC for Processing Job(s). These Export Sets can then be exported.
-
Data Extract
Exports: displays a list of all the exported Processing Jobs and
Data Extract Jobs. When
you right-click Data Extract Exports, a context
menu displays with two options: New Data Extract Export Job and New Data
Extract Export Series.
-
Data Extract
Export Sets: displays a list of the Export Sets created in QC
for Data Extract Job(s). These Export sets can then be exported.
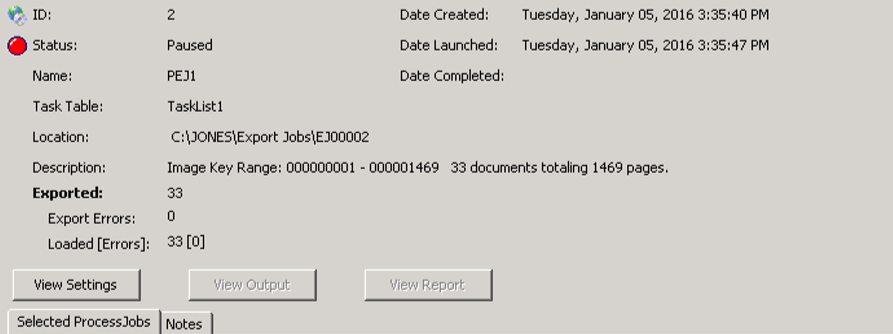
Process/Data Extract Export Jobs
The information that displays in the Data
Panel for either Process Export Job or a Data
Extract Export Job includes: ID, Status, Name, Task Table, Location,
Description (Path where job files and the SETTINGS.INI file are located), Exported
count, Export Errors, Loaded [Errors], Date Created, Date Launched, Date
Completed, and a list of Process Jobs (ID, Name, Status, Items, and Description).
The Exported [Errors] field shows the
total number of exported documents with any encountered errors in brackets.
The Loaded [Errors] field shows the total number of exported documents
with any autoload errors (for either Eclipse or Relativity) in brackets.
For Streaming Discovery and Export Jobs that are not autoloading into
Eclipse or Relativity; and for incomplete Export Jobs, the Loaded
field will be blank. Exported and Loaded item counts will reflect
only completed Export jobs. As Export Jobs connected to Streaming Discovery
Jobs are completed, the counts will increase. The Loaded count will match
the Exported documents count unless errors occur during an Eclipse
or Relativity autoload.
- Clicking
 opens
the Settings for Process Export Job dialog box to let you view the settings for
the selected Exported Processing Job.
opens
the Settings for Process Export Job dialog box to let you view the settings for
the selected Exported Processing Job.
- Clicking
 accesses
the export directory to let you view the output. The View Output button will
be grayed out for any Export Job that has not yet completed.
accesses
the export directory to let you view the output. The View Output button will
be grayed out for any Export Job that has not yet completed.
- Clicking
 opens
the Export Summary Report for the selected Process Export Job or Data
Extract Export Job (including Eclipse and Relativity). The Summary Report
differs for the type of export job. Information includes: Job Name, Volume
Name, Categories, Export Errors (if any), # of Documents, # of Pages,
Exported Size, Original Size Bytes, # of Volumes, Image Key Range, Date
Created, Date Completed, and Export Location. Click Save Report to save the report to a CSV file.
opens
the Export Summary Report for the selected Process Export Job or Data
Extract Export Job (including Eclipse and Relativity). The Summary Report
differs for the type of export job. Information includes: Job Name, Volume
Name, Categories, Export Errors (if any), # of Documents, # of Pages,
Exported Size, Original Size Bytes, # of Volumes, Image Key Range, Date
Created, Date Completed, and Export Location. Click Save Report to save the report to a CSV file.
Process/Data Extract Job Export Series
An Export
Series can be created for either Process Exports or Data Extract
Exports. The information that displays in the Data Panel includes: ID,
Name, Description, Initial Bates, Next Bates, Initial Volume, Next Volume,
Date Created, and the Export Jobs in the Series.
- Clicking opens the Settings
for Process Export Series dialog box to let you view the settings for the selected Export Series.
- Clicking
 opens the Export dialog box
that contains the Export Formats and the File Handling Options. The most
recent options are displayed for the Series. Change these options and make any additional changes to the remaining Export dialog boxes.
Any new jobs created going forward will use the new settings.
opens the Export dialog box
that contains the Export Formats and the File Handling Options. The most
recent options are displayed for the Series. Change these options and make any additional changes to the remaining Export dialog boxes.
Any new jobs created going forward will use the new settings.
- Clicking opens the Export Series Summary Report for the selected Process Export Job or Data Extract Export Job. The Export Series Summary Report shows Series Name, Export Job Name, Volume
Name, Category, and Export Errors (if any) along with # of Documents,
Exported Size, Original Size, Image Key Range, and # of Volumes. Click
Save Report to save the report to a CSV file. The Original Size is the sum of
the native file size of parent documents in the export as opposed to the
parent documents in the Discovery Job. (For example, Discovery Job
parents can be excluded from exports by the Flex Processor Rules Manager
so that child documents can be exported as standalone documents rather than children. If this occurs, the native file size will be included in
the total.)
-
The Export Jobs in Series tab shows the ID, Name, Status, Exported [Errors],
Loaded [Errors] Bates Range, Volumes, and Volume Range. The Exported [Errors]
column shows the total number of exported documents with any encountered
errors in brackets. The Loaded [Errors] column shows the total number
of exported documents with any autoload errors (for either IPRO Eclipse
or Relativity) in brackets. For Streaming Discovery and Export Jobs that
are not autoloading into IPRO Eclipse or Relativity; and for incomplete
Export Jobs, the Loaded field will be blank. Exported and Loaded document
counts will only reflect completed Export jobs. As Export Jobs connected
to Streaming Discovery Jobs are completed, the counts will increase. The
Loaded count will match the Exported documents count unless errors occur
during an Eclipse or Relativity autoload.
-
The Notes tab is used to enter pertinent information.
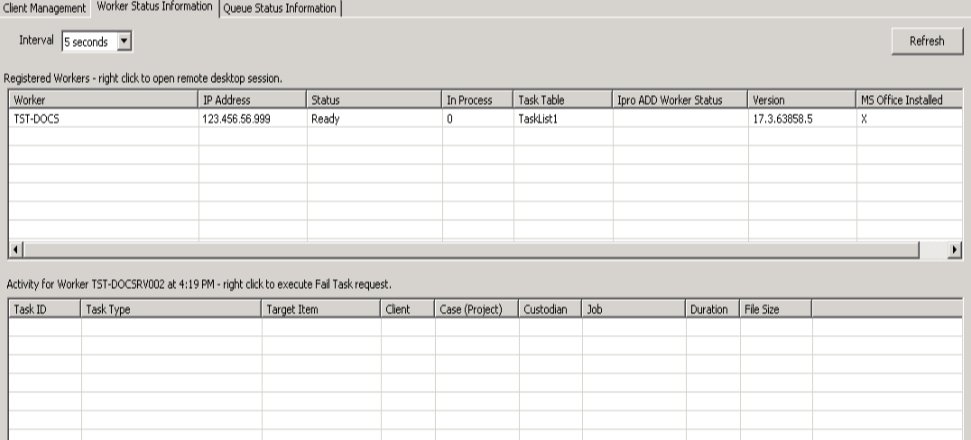
The eCapture Queue Manager is responsible for the data shown in
the Worker Status Information tab.
The Registered
Workers grid shows:
-
The interval value, in seconds. To adjust this
value, click the arrow of the drop-down menu and select an interval value
in seconds. To manually refresh, click  .
.
-
Each of the Workers that are connected to the
eCapture Controller
-
Each worker's IP Address
-
The Status of the worker (inactive, ready, assigned,
busy, inaccessible path, low disk space, print spooler error,
pending cleanup, graceful shutdown, restarting, and bandwidth
limit reached)
-
The number of items In Process for the worker (discovery jobs, export
jobs, and data extraction jobs) or percentage (%) in process (processing
jobs only)
-
The Task Table name
-
The Enterprise Worker Status:
- Eligible - indicates the Worker
will be assigned both eCapture and Enterprise tasks
- Exclusive
- indicates the Worker will be assigned Enterprise tasks only
[excluding Enterprise Streaming tasks], or blank
- Ineligible
- indicates these Workers will not be assigned Enterprise tasks
-
The Version number of the eCapture Controller.
-
Whether MS Office is Installed on the Worker. An X indicates Microsoft
Office is installed for a specific Worker. The WorkerRegistry.HostMachineHasOffice
field is set when the Workers start up and register themselves
by inserting/updating their WorkerRegistry record. A value of 1 indicates Office is installed for the Worker. A value of 0 indicates
Office is not installed for the Worker.
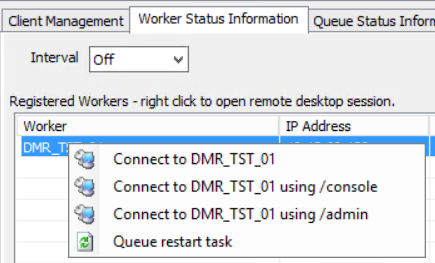
Right-click a worker in the Registered Workers grid to display
a right-click context menu. On the menu, you can connect to a remote worker. Connection is available
either by using the worker name, worker IP address, or through a custom port
setting.
Select from:
-
Connect to Worker by using /mstsc/console - No
arguments
-
Connect to Worker by using /console
-
Connect to Worker by using /admin
-
Queue a restart task - Right-click a worker
in the Registered Workers grid to display the context menu. Choose Queue
Restart Task for an active Worker. This option is not visible on the Limited
Controller.
The Activity
for Worker grid shows the present activity of the Worker selected
in the Registered Workers grid located above. The activity includes:
-
Task ID
Task Type - discover files
in a directory
-
Target Item - the path
where the files are being stored as they are created
-
Client
-
Case (Project)
-
Custodian
-
Job
-
Duration - Dsplays the
length of time (minutes and seconds) since the task was accepted by
the Worker. This column is populated for all task types.
-
File size - Displays the
size of the file (in kilobytes) being handled by the task. This column
is populated only for Processing and Data Extract tasks.
To fail a task type, Right-click the task to display
 . This option is not available in the Limited Controller. Not all Task Types are available
to fail.) Click to display
the Fail Task of type Process File dialog box. The message in this dialog box may vary depending on the selected task.
. This option is not available in the Limited Controller. Not all Task Types are available
to fail.) Click to display
the Fail Task of type Process File dialog box. The message in this dialog box may vary depending on the selected task.
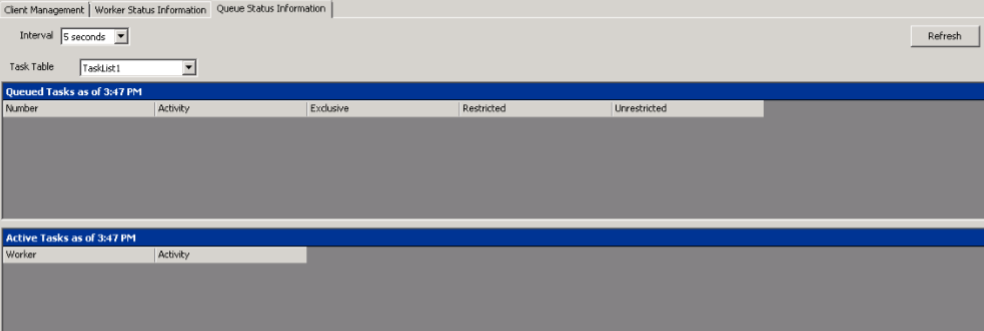
The Queue Status Information Panel displays the queued and active tasks by task table.
The two options located above the Queued Task and Active Task grids are:
- Interval value shown in seconds. To adjust this value, click the arrow of the drop-down menu and select an interval value in seconds. To manually refresh, click .
- The Task Table drop-down menu lists the Task Tables. Multiple eCapture Workers can be assigned to a specific task table. Click the drop-down menu to select a task table. The grid information below displays information pertaining to the newly selected task table.
The Queued Tasks Grid shows the:
- Number of Queued Tasks
-
Activity (process file, etc.)
|
|
Note: For Index Folders, one at a time will display. Therefore, 1 will appear in the Number column and the individual Index Folder n, (where n represents the Index Folder’s number), will appear in the Activity column.
|
-
Task designation: The task designation for the selected task.
- Unrestricted - Tasks of this type may be performed by any worker at any time.
- Restricted - One task of this type at a time per worker.
- Exclusive - Only one of that type per Discovery Job, usually indexing.
The Active Tasks Grid shows the Worker and the Activity being performed on that Worker.
The eCapture Controller Status Bar at the bottom of
the Controller shows:

-
Database Server: The database server
(SQL Server) that eCapture is connected to.
-
Database: The database currently
being accessed.
- Subscription:
-
Authorization Status: Indicates
authorization type.
-
Authorized by server: This shows
the Server IP and port number (or name) that is used for eCapture’s
authorization.
-
QM: Displays the computer name the
Queue Manager is running on.
Related Topics
Create a New Managing Client and a New Client
Create a New Case (Project)
Create a New Custodian
Overview: Jobs
Introduction to eCapture QC
Overview: Jobs
Overview: Enterprise Integration